Like many people including, I suspect, most of the web industry I avoid Internet Explorer as much as I can and my cross browser (i.e. IE) testing can be somewhat curtailed: I do it with the site in my development environment and with an eye to degrading gracefully – if you’re using 10 year old software, you can take the degraded experience and be happy you get that much.
Today I had to look at a client’s web-site to resolve a performance problem that I’d heard of a few times but had never been able to reproduce. The reports looked something like this:
Can you look take a look at our site again? It’s very slow to load the page but all the other sites I try are fast. It works find on [manager’s] Mac but my PC and the rest are all slow.
First things first, I fired up a Windows install in Virtual Box and found that, yes, it was indeed slow on IE (but not on any other browser I tried).
Given that there’s a bit of fancy schmancy JavaScript going that was my next port of call. After a while trying to find the option to disable JavaScript (Internet Explorer has one of the worst configuration interfaces of pretty much any software I’ve used) I remembered that this install had the developer toolbar installed. A quick navigate through three or four layers of menu (Seriously Microsoft: try giving some consideration to user experience one day. You might find you like it!) and a visit to Disable -> Scripts and I’d confirmed that yes, the problem was only seen with scripting enabled.
There are various bits of jQuery used on the site including a light-box
popup thing, a slideshow type arrangement and a few custom bits. I cloned the
site into my development environment and prepared to set to with my trusty
/* */. Horror of horrors, the problem went away. A few goes back and forth
over hosts and it was clear – the problem happened “live” (with JavaScript)
but didn’t happen at all locally. Crap.
As a last resort before breaking a live site to try to diagnose the issue I appealed to Twitter. A few responses from some helpful sorts didn’t point out any obvious things to check (and pretty much discounted my own theory of blaming: my favourite of Microsoft’s misfeatures, filters). In a last ditch effort to find the problem without disabling bits of the live site I appealed again to Twitter for someone to jog my memory. I remembered a site that I’d seen before (in mid-October, it turns out) that provided performance data and screenshots from real browsers. Nick Cowie replied with the linked that saved me hours: I was looking for webpagetest.org!
WebPagetest is a free web-page performance service. Give it a URL (and maybe set some options), wait a little while, and you get back report about your site. Like most such things you get a screen shot, but more usefully WebPagetest provides a timeline of fetching and rendering the page. Here’s an edited screenshot of that first report:
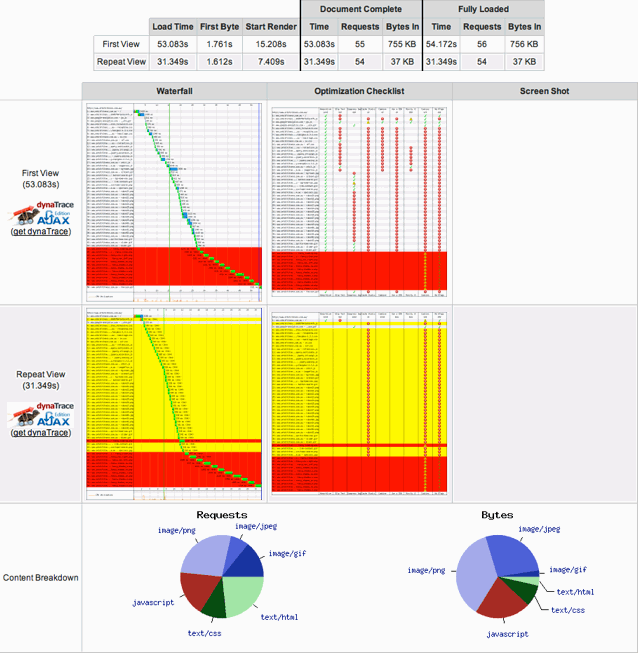
Notice, if you will, all that red and yellow and the fact that the initial
request took 53 seconds and subsequent requests took 31 seconds! A closer look
at the waterfall chart shows that around a third of the time to load and
render the page comes from those red requests – about a dozen requests that
result in 404s – so I set about fixing them. It was evident that they were
images that form the border of the Fancybox “popup” and a quick grep
saw that they were referenced from fancybox.css with a relative path. I was
wrong when I though that filters weren’t to blame: Microsoft’s
filter hack interprets paths to images relative to the document
being displayed not the stylesheet it is defined in (unlike every other
reference to an external resource in a stylesheet). One such error might not
be a problem: a silly, preventable mistake, but not critical (beyond the
resource not being loaded and used). A dozen means that IE stalls for
12 URLs / 2 connections * load time which can be ages if your slowish CMS
is serving the 404 pages.
I fixed the missing files (by duplicating them to the expected location, I’m afraid) and the load time dropped by some 20 seconds. Job done.
All that yellow looked a bit dodgy though, so I kept going. Most of that is
indicating requests that could have been cached on the client but weren’t
because of configuration issues. I added some ExpiresDefault server
directives and pretty much all that yellow went away:
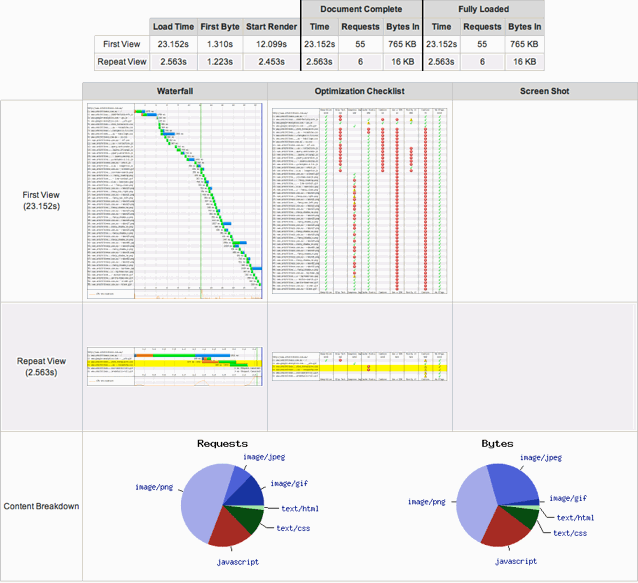
Resolving a few 404 errors that slipped through the obviously gaping cracks in our QA procedure and correcting some server configuration oversights took this site from load and render times of 53 seconds and 31 seconds (initial and subsequent, respectively) down to 23 seconds and 2.6 seconds!
There are three things that have come out of this experience:
The client’s problem has finally been resolved.
It’s pretty clear that I’ve got a lot of work to do improving our quality assurance procedures.
It’s also clear that developing a server configuration with reasonable defaults will result in some dramatic performance improvements.
Now it’s time to fill these gaps so that we catch this type of issue and pick these low-hanging fruit in our current and future work.